
Charting the Impact of Covid-19 on Air Travel Using ADS-B Data (Part 1)
Using crowdsourced flight tracking data, we quantified Covid-19’s unprecedented disruption to air travel. Here in Part 1 we show how we did it using the OpenSky Network dataset, and in Part 2 we show what we found.
 by
by Covid-19 as seen through geospatial data
Air travel has been drastically affected by Covid-19, and although some air corridors have started to re-open, normal service seems far from resuming. We wondered if we could crunch some data to see how far from normal worldwide air traffic actually is.
The OpenSky Network
We searched for a data source that might be able to answer this question, and came across the OpenSky Network, an API providing flight data for airports across the world.
After fetching some data from the API (which was very user-friendly), we noticed not all airports are covered, e.g. a search for flights in and out of Wuhan Tainhe International Airport gave us nothing. In trying to find out why, we dug deeper into how the OpenSky Network dataset is generated, and realised it’s a great story in itself.
The OpenSky Network is a non-profit association founded in 2012 as a research project between Armasuisse (Switzerland), University of Kaiserslautern (Germany), and University of Oxford (UK). Its aim is to improve the security, reliability and efficiency of air space usage by providing open access of real-world air traffic control data.
We initially thought the data was somehow obtained from airports themselves. But it turns out the data is crowdsourced from a plethora of sensors connected to the Internet by private volunteers, industrial supporters, and academic/governmental organizations. The collected data is then archived in a large historical database. This also explains why not every airport is covered yet.
Anyone can add to the dataset with information about flight traffic near them - and tracking the planes flying overhead is surprisingly simple and cheap. It all comes down to the Automatic Dependent Surveillance-Broadcast (ADS-B) system and Mode S.
ADS-B & Mode S
Automatic dependent surveillance-broadcast is a primary surveillance technology found in aircraft that determines their position via satellite navigation and periodically broadcasts it.
Mode S is then a secondary surveillance radar process. It uses a unique 24-bit address for each aircraft to allow selective interrogation of the aircraft. These signals can be be picked up using software defined radio receiver (SDR receiver).
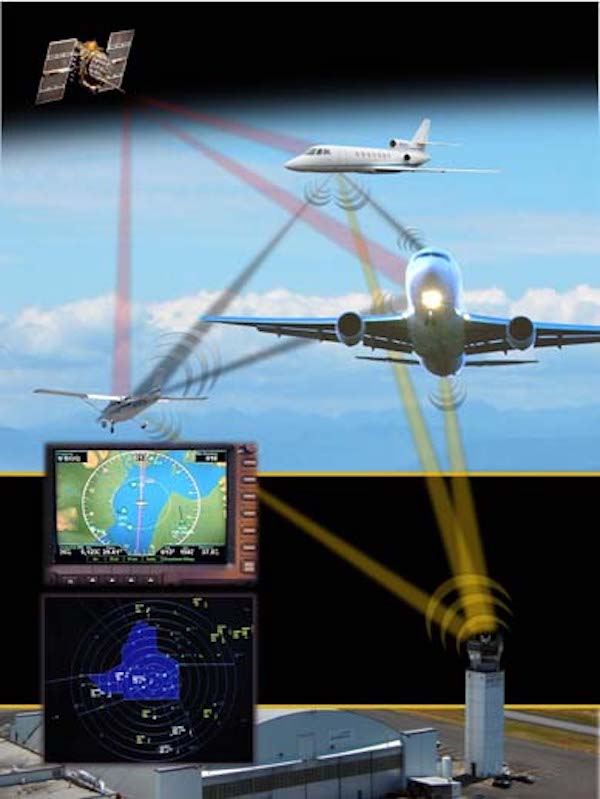 Basic graphic of ADS-B by the FAA
Simply put, it’s a way for planes to communicate their positions with each other and with air traffic control. And since Mode S is broadcast by radio on the 1090 MHz frequency band, it’s possible to listen out for planes flying overhead with the right kit. We decided to give it a try ourselves.
 Software Defined Radio Receiver (SDR) USB stick with banana for scale
We purchased a cheap Software Defined Radio Receiver USB stick and used a combination of the Dump1090 software (written by antirez, yes of Redis fame) to retrieve the raw data of each nearby aircraft. Below shows an example of two aircraft within the receiver’s range.
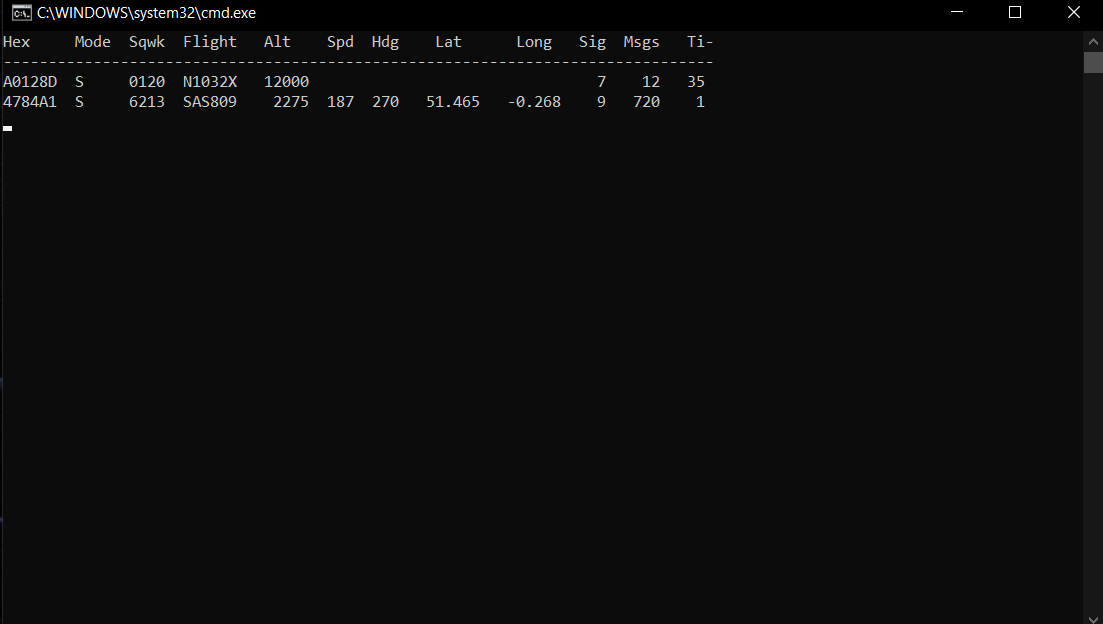 raw terminal output of Dump1090
In order to convert this raw data into a more visual format, we used Virtual Radar on Windows. This decodes the raw data and uses it to plot the flight path on a map. The software also allows users to identify the type of aircraft, as well as the airline and destination.
Below shows an animation of how a RyanAir Boeing 737 makes it way from London Heathrow to Ireland.
 GUI output of Dump1090
An OpenSky Network contributor would keep monitoring this radio data, and would then upload it to the OpenSky Network database. Many thousands of other contributors around the world also doing this creates a dataset of worldwide air traffic that is being used to track the pandemic and to measure its secondary effects.
OpenSky Network has released a special Covid-19 dataset, which has proven invaluable to researchers from a multitude of fields. For example the Bank of England has been using the flight data for some of its Covid-19 economic indicators.
So what does the data show?
Below is a plot of air traffic in and out of various airports in Europe.
Select European air traffic late 2019 through 2020
This is just a tidbit of what we found in the data. To see the rest, head on over to Part 2!
Sachin and Rahman - team@synced.to
Explore more on the Synced app, where you can find meaningful places, nearaway and faraway.